LMT
Overview
Blocks OS provides powerful tools for managing and monitoring your services:
- Logs: View and filter logs for your services, analyze issues, and ask AI for insights.
- Traces: Monitor service traces, filter by date or service name, and analyze detailed trace timelines.
Logs
Logs provide detailed records of events and actions within your services. They help you debug issues, monitor activity, and ensure your services are running smoothly.
Key Features
- Filter Logs: Filter logs by date or log level (INFORMATION, WARNING, ERROR).
- Search Logs: Use the search bar to find specific log entries.
- Ask AI: Get insights and answers about your logs using AI.
Viewing the Logs
Navigate to Services → Logs.
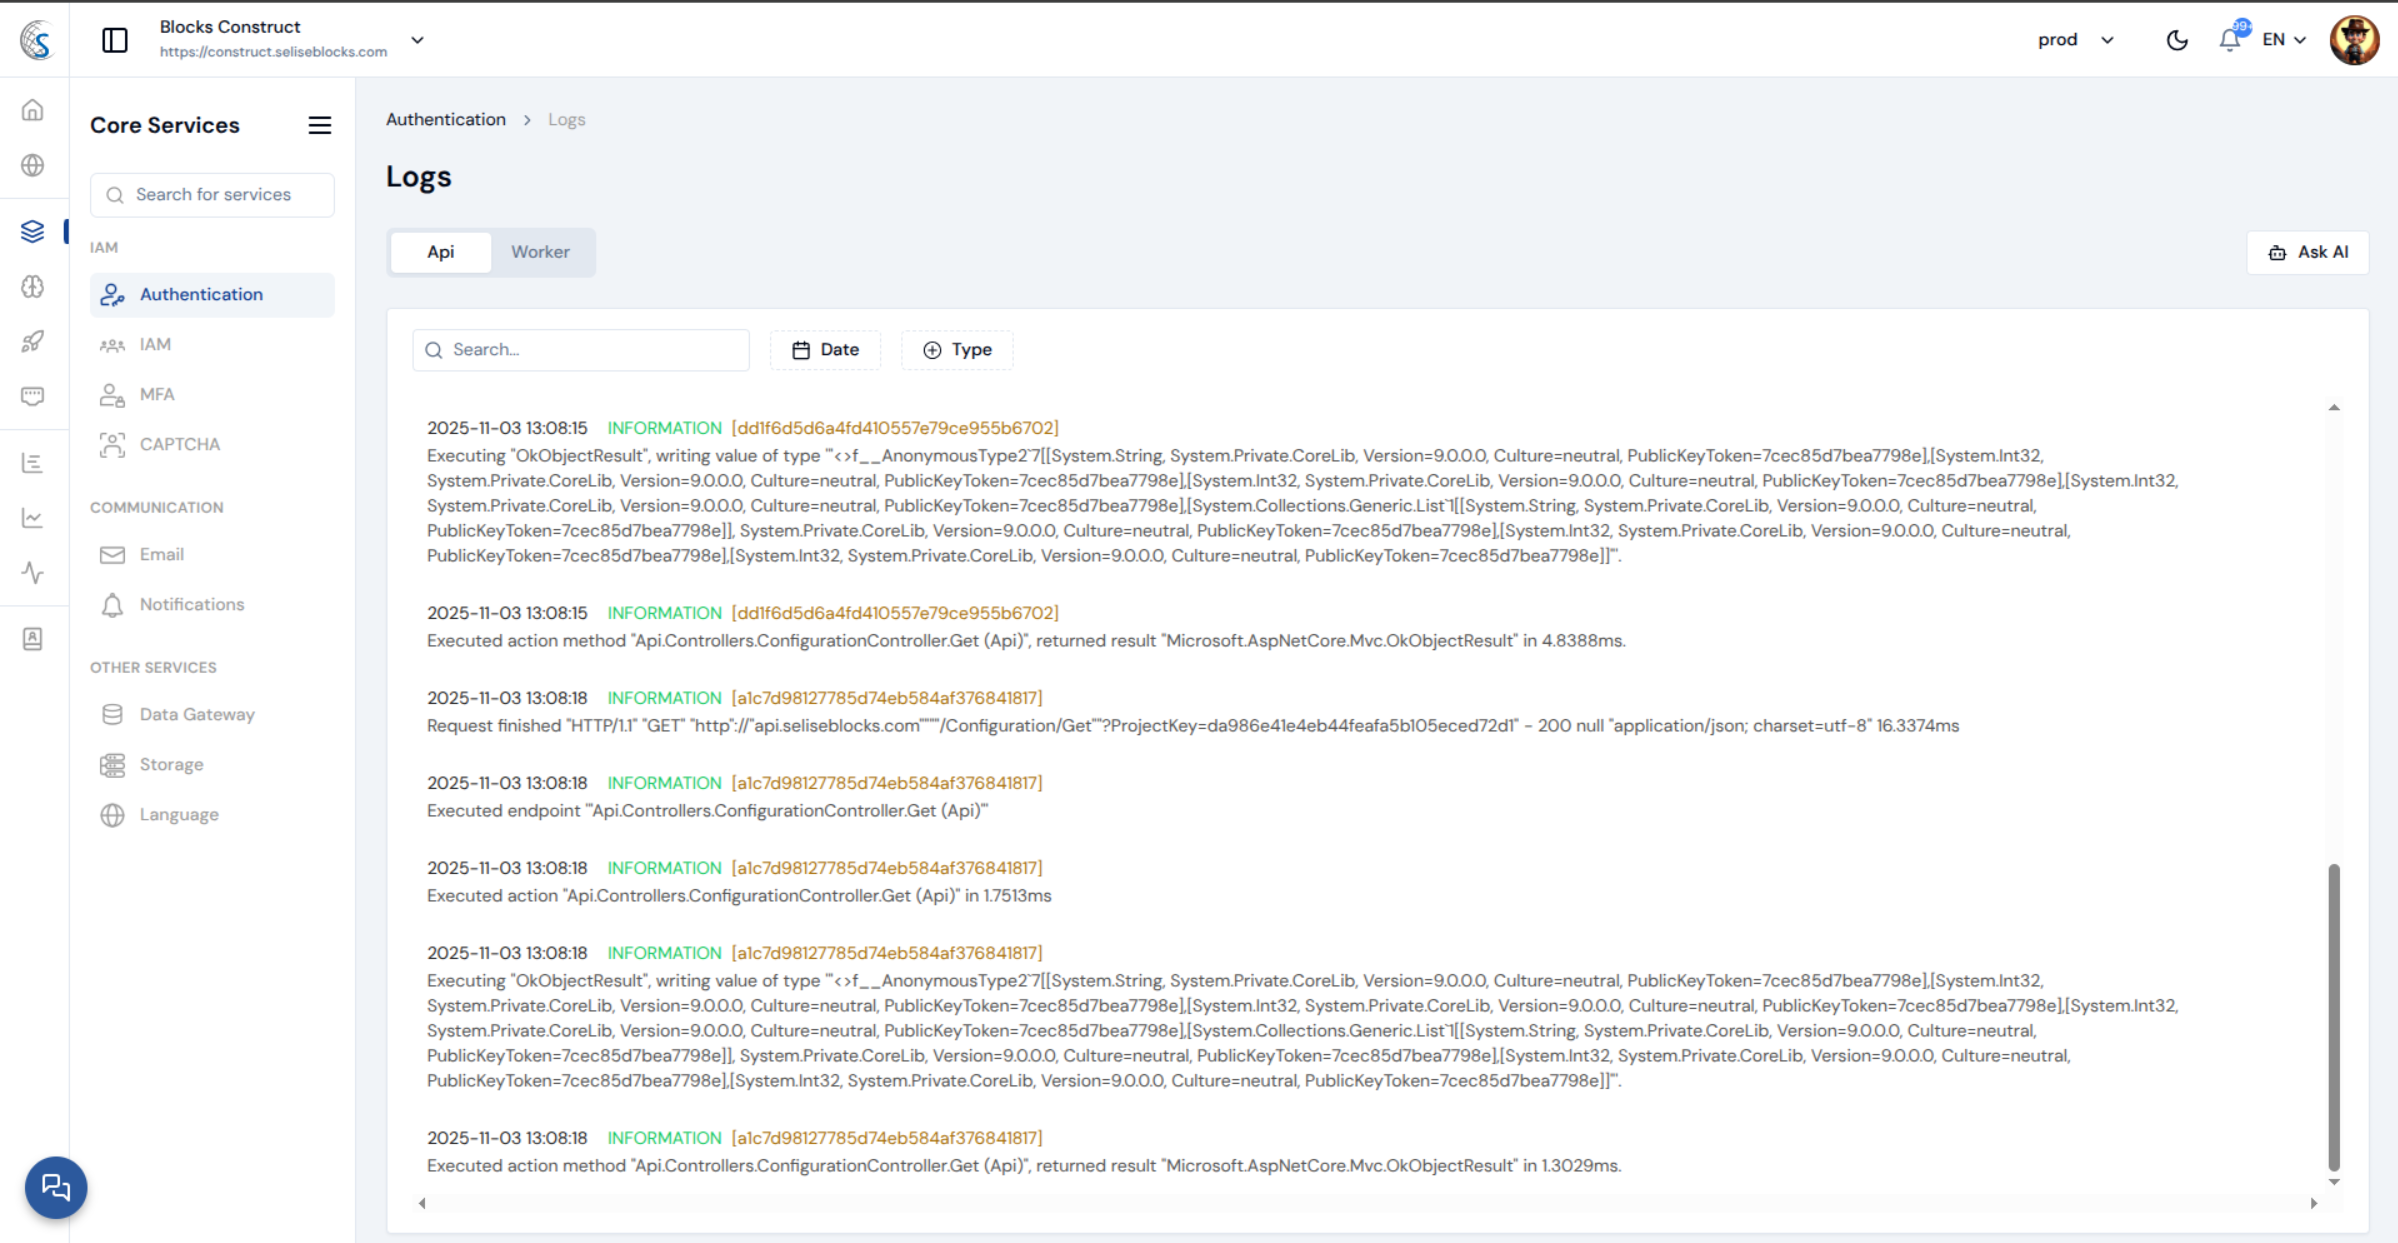 Select the service you want to view logs for (e.g., Authentication, IAM, Storage).
Click on a log entry's trace id to view its details.
Using AI for Log Analysis
Open the Ask AI panel on the right.
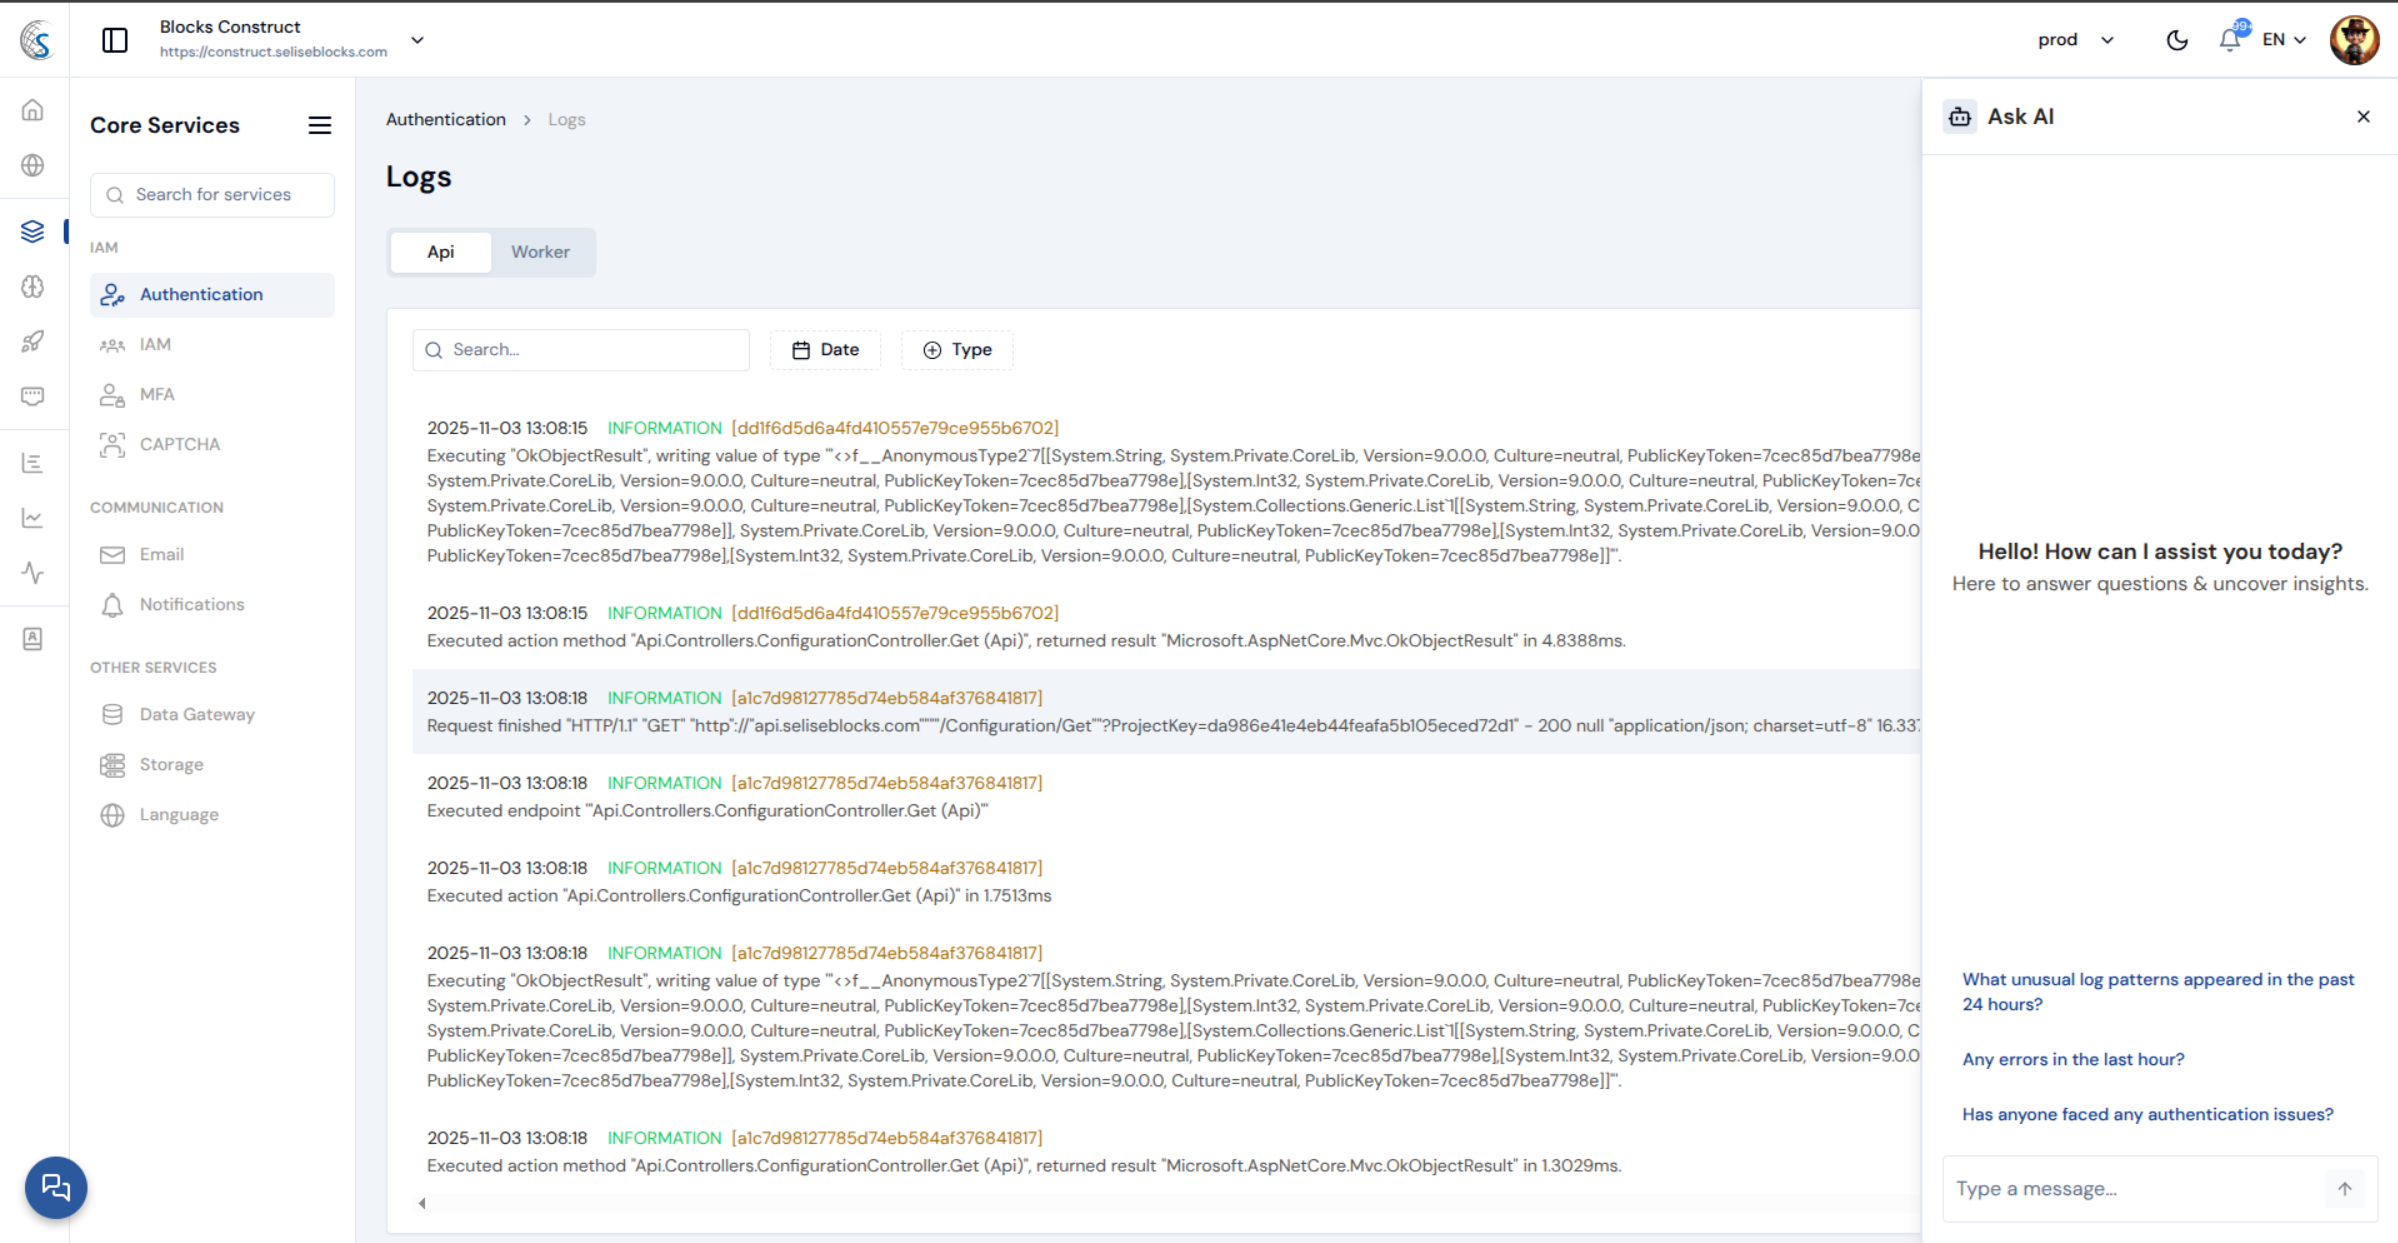
Type your query.
Traces
Traces provide a timeline of requests and actions within your services. They help you monitor performance, identify bottlenecks, and debug issues.
Key Features
- Trace List: View all traces for your services.
- Filter Traces: Filter traces by date or service name.
- Trace Details: Analyze individual traces, including timelines, annotations, and attributes.
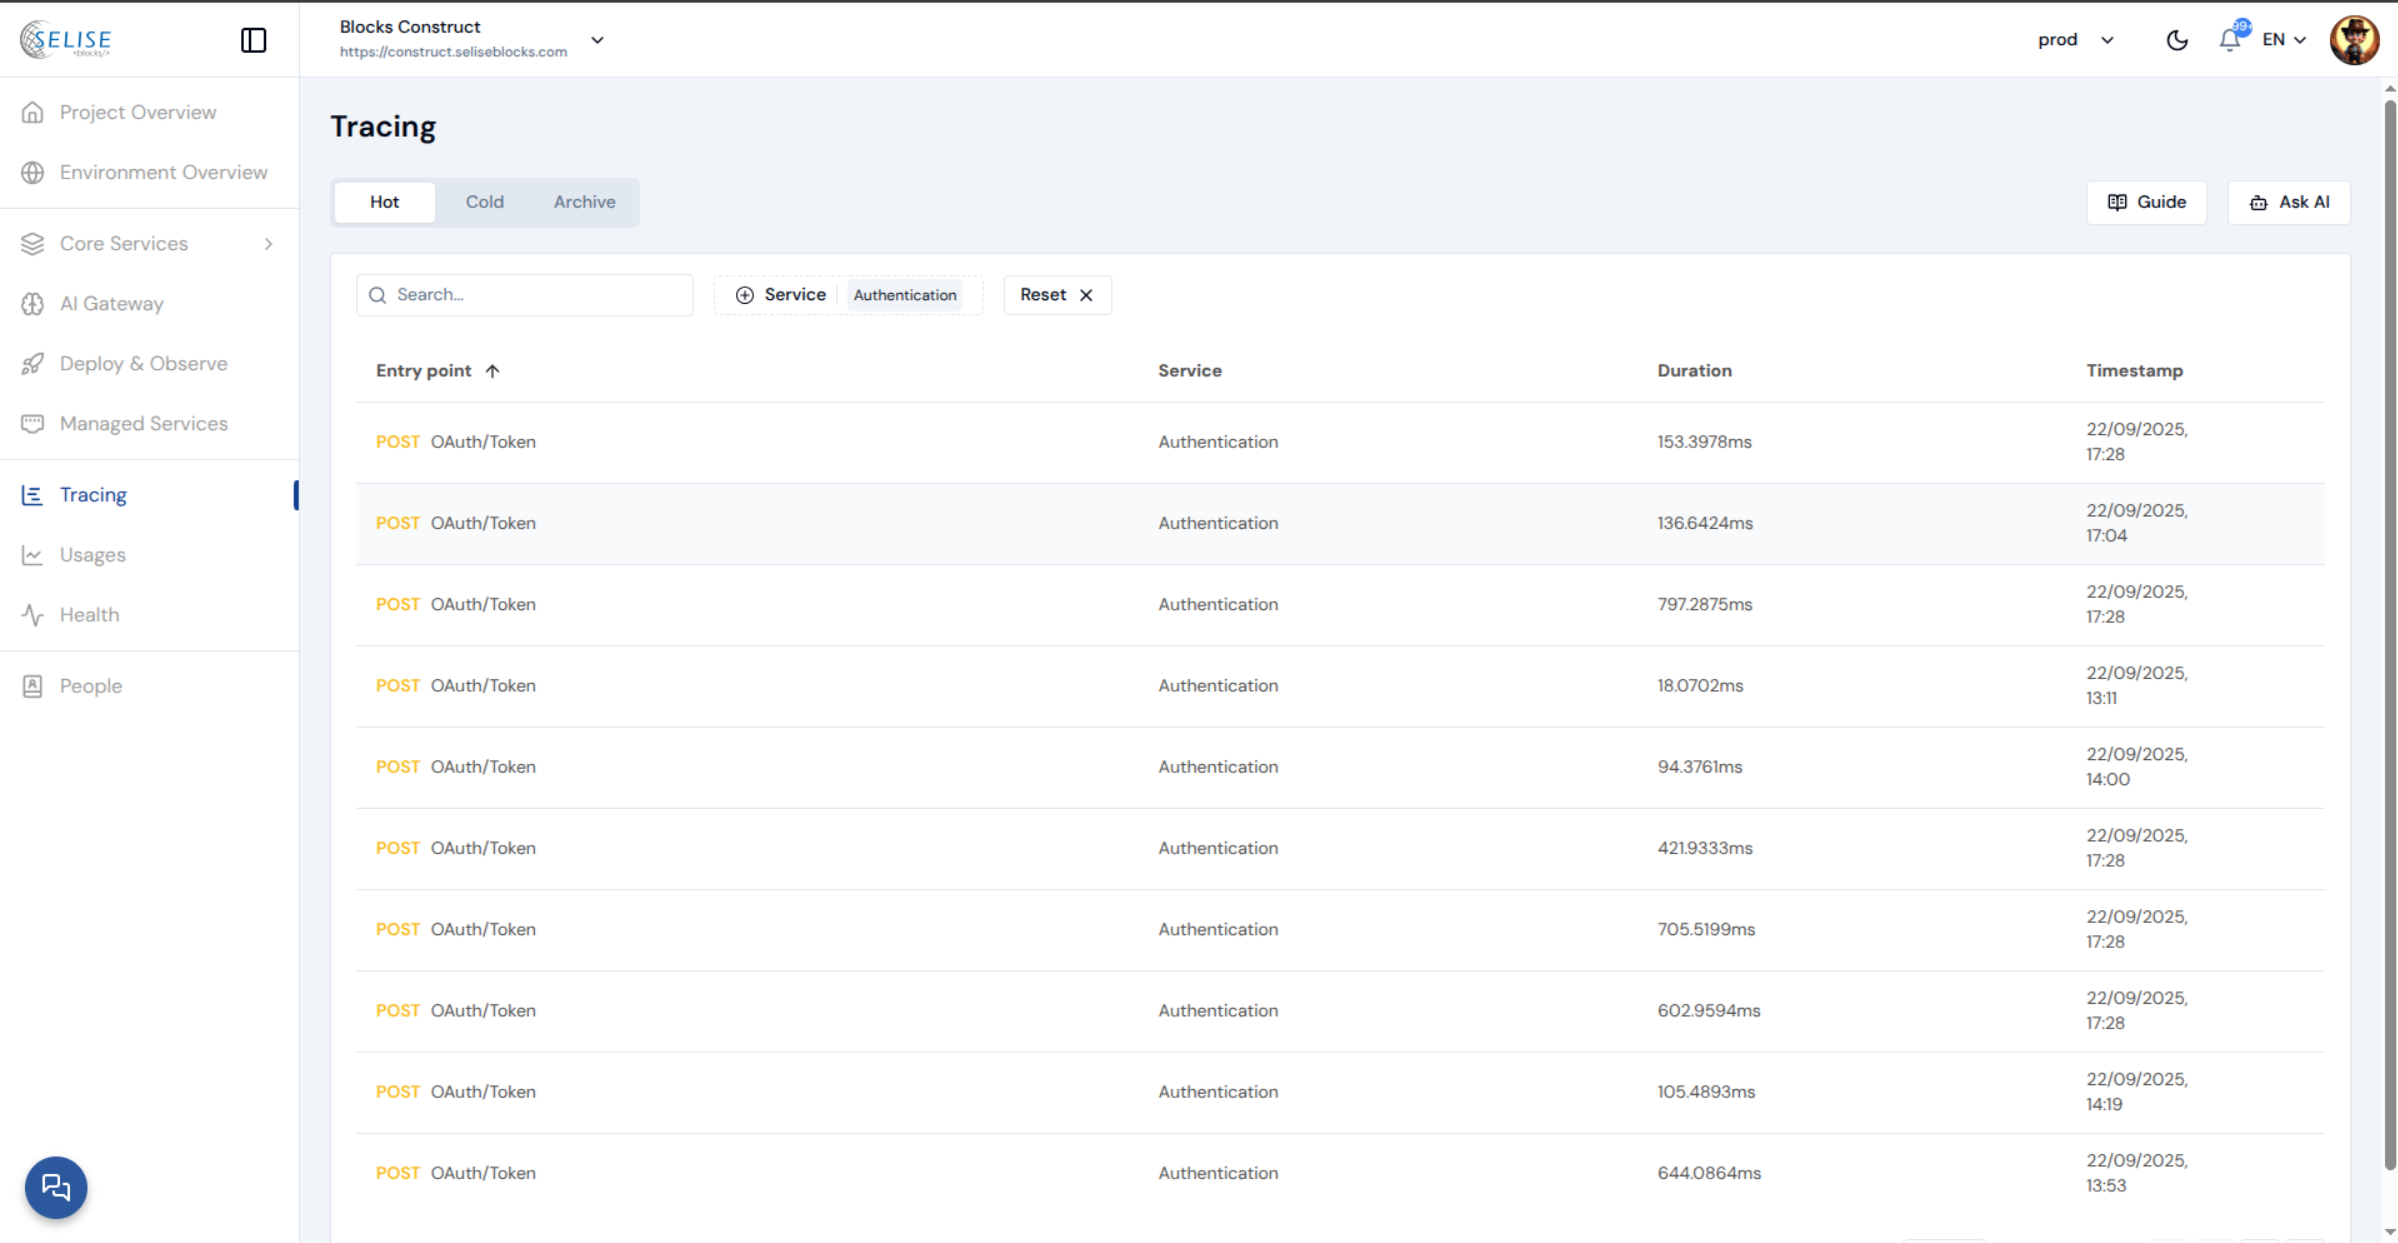
Use the filters to narrow down the trace list:
- Date: Select a specific date range.
- Service Name: Filter traces by service name (e.g., Authentication, Storage).

Using AI to Query Tracing Information
Open the Ask AI panel on the right.
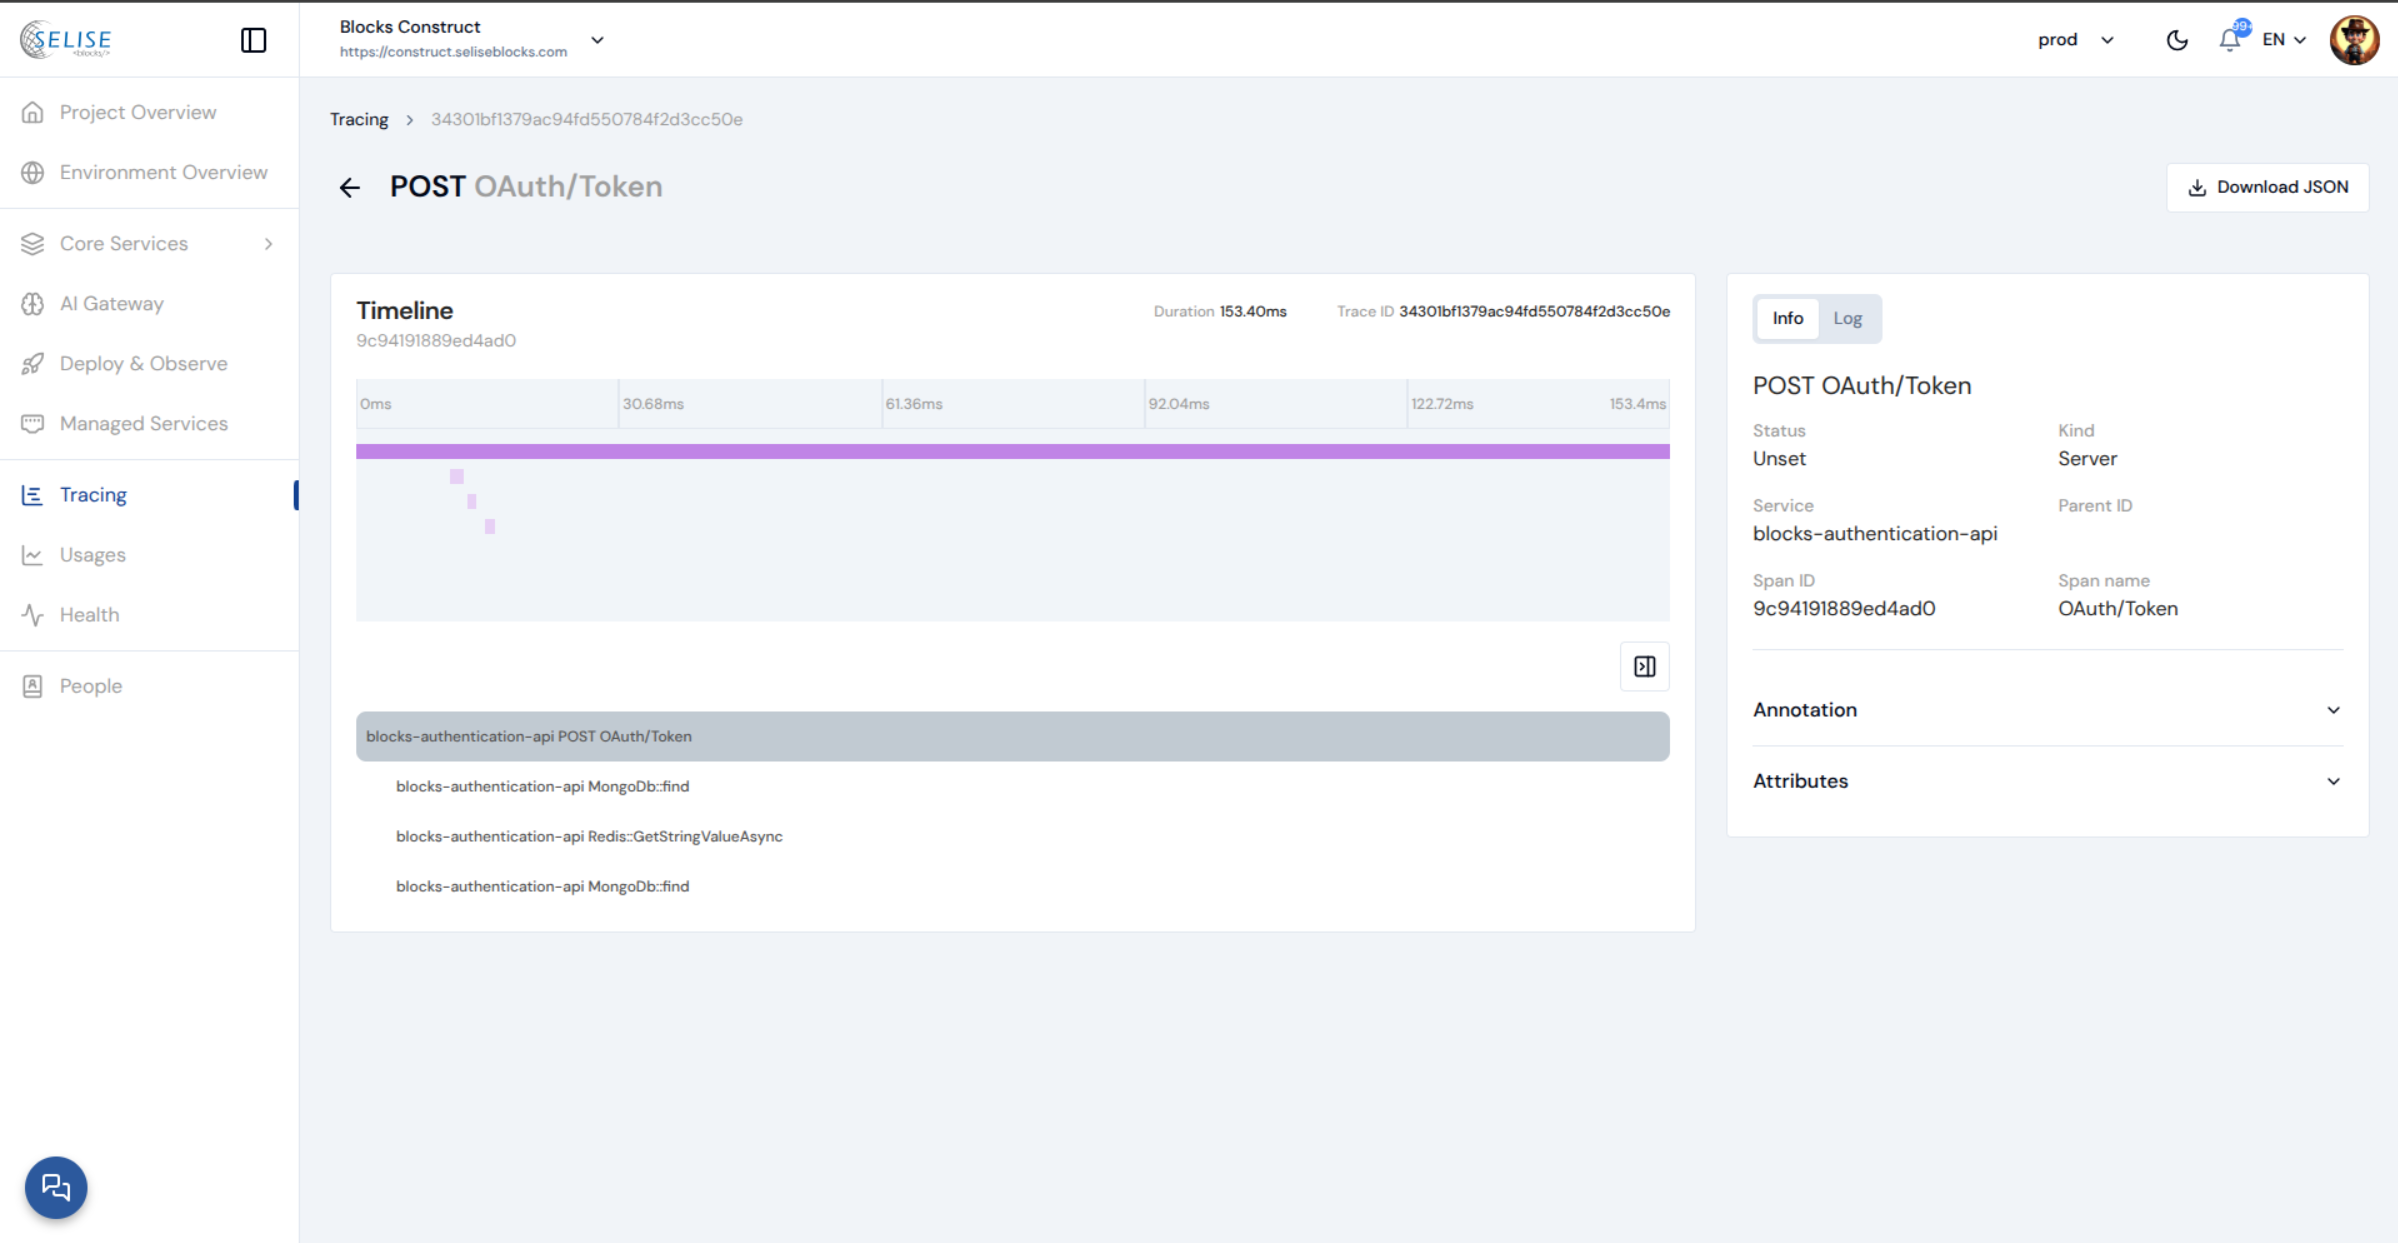 Click on a trace entry to view its details.
Analyzing Trace Details
Select a trace from the list.
View the timeline to analyze request durations and dependencies.
Check the Info tab for key details:
- Status: Success, Error, etc.
- Service: The service that generated the trace.
- Span ID: Unique identifier for the trace span.
Use the Log tab to view logs associated with the trace.
These observability tools are not limited to Blocks' microservices. You can use them for your own deployed service, as well. See our guide for integrating your services.
Usages
Overview
Usage metrics provide detailed insights into how your services are being utilized. By analyzing these metrics, you can monitor service performance, identify bottlenecks, optimize resource allocation, and make informed decisions about scaling and improvements.
These metrics are especially useful for tracking trends over time, understanding which services are most frequently used, and detecting unusual activity that may require investigation.
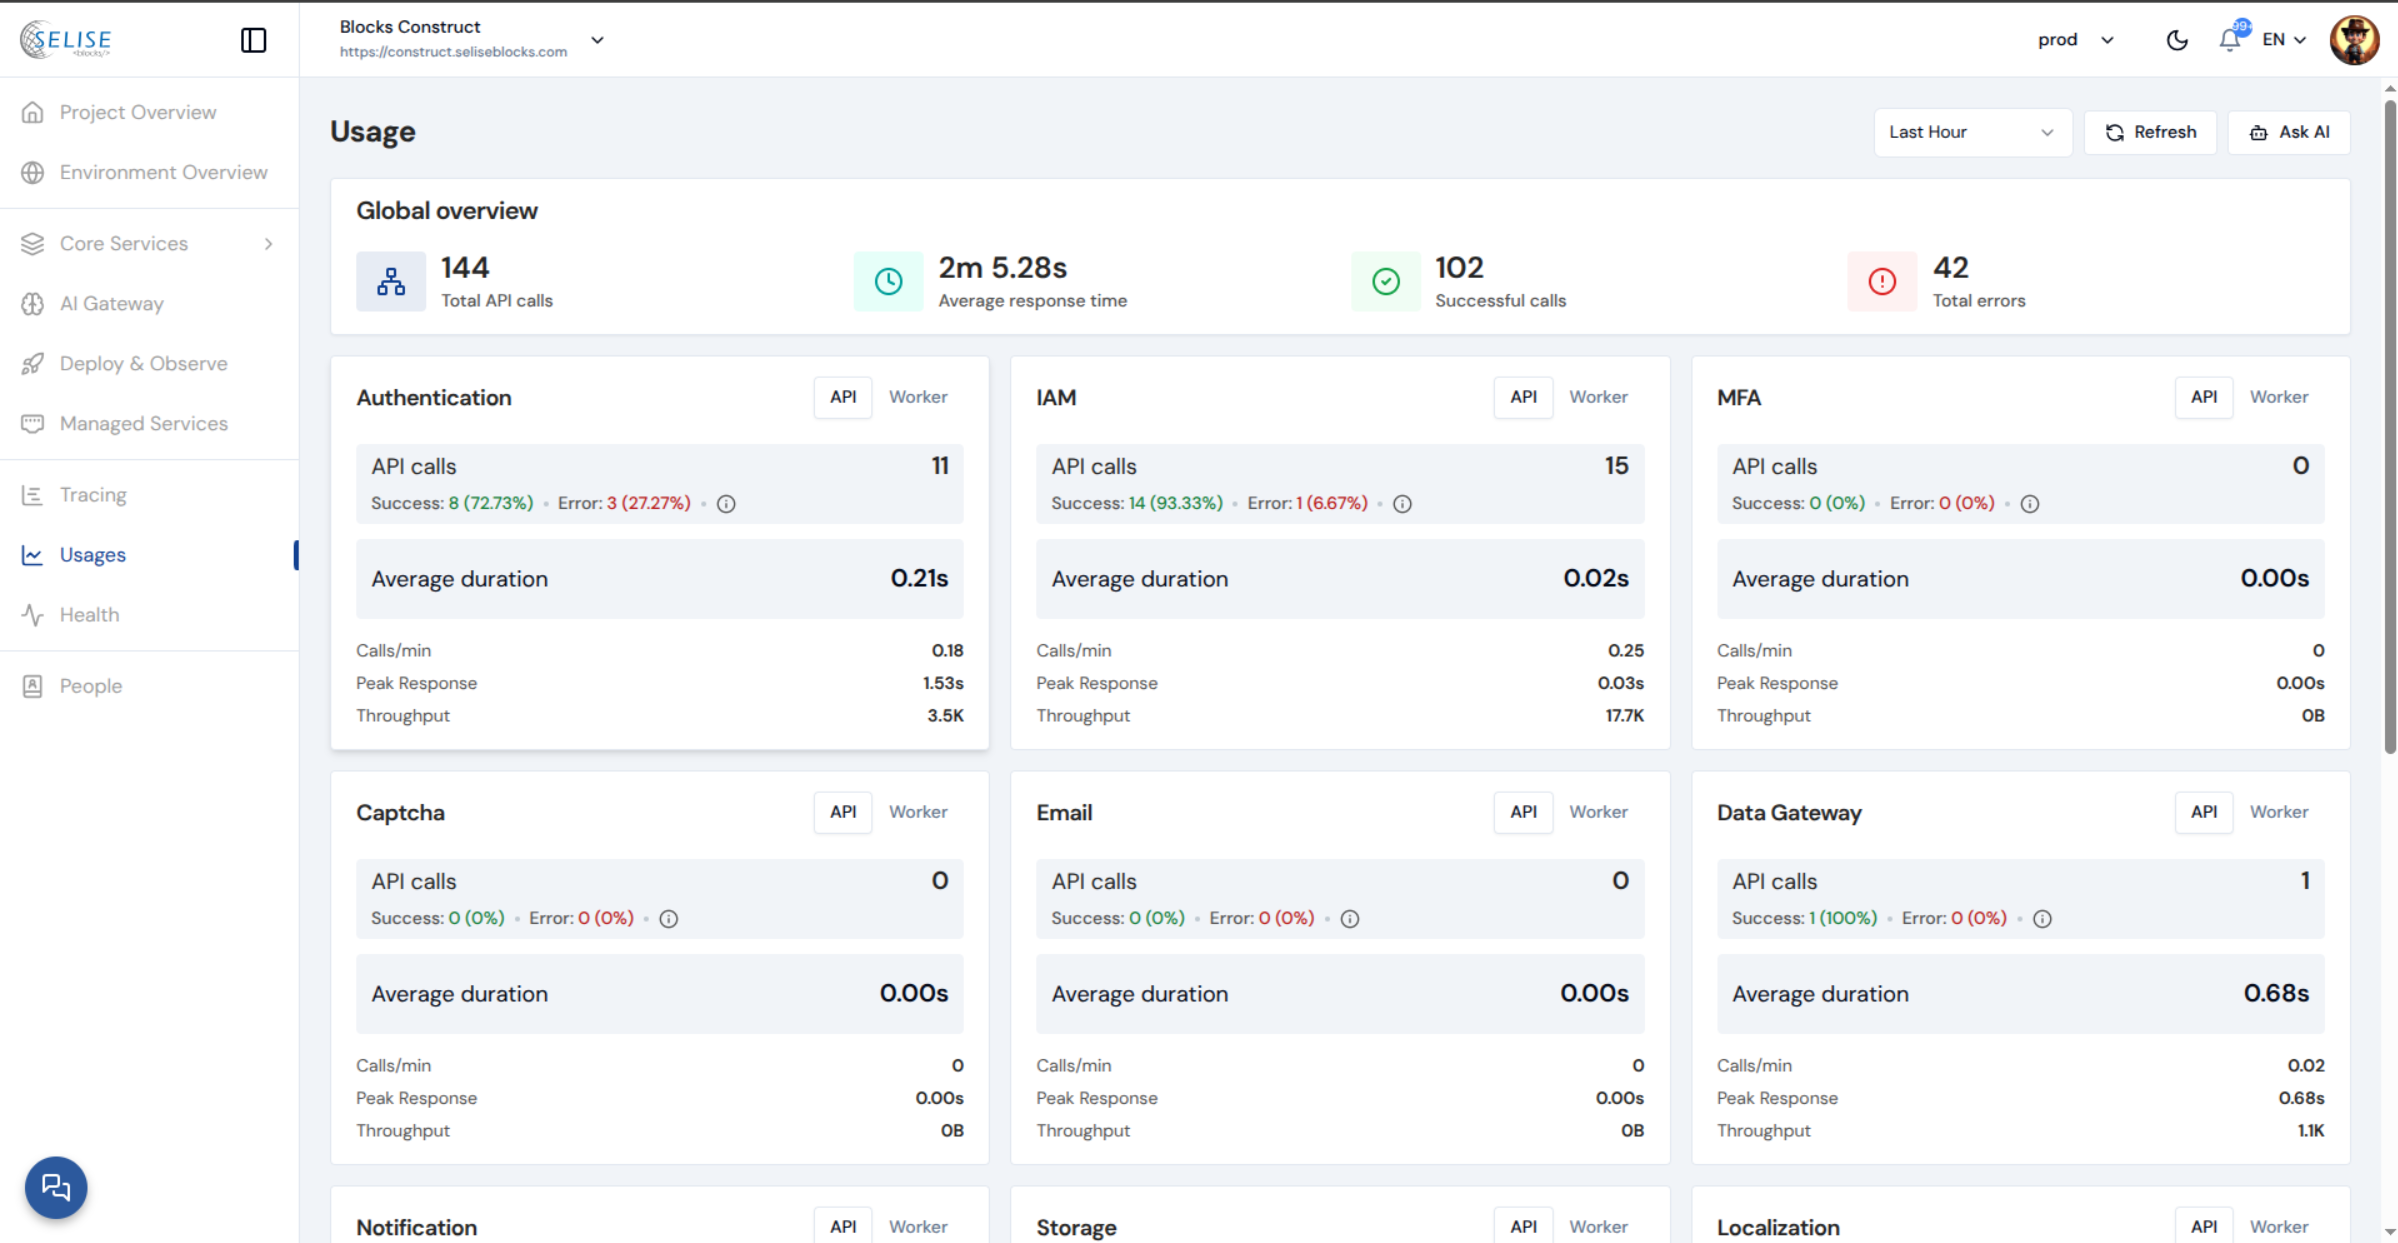
Key Features
- Service Metrics: View usage statistics for core services such as Authentication, IAM, Storage, and MFA.
- Filter the Metrics: You can filter the metrics based on time ranges.
- Ask AI: Get information on the usage data from an interactive AI agent.
Viewing Usage Metrics
- Navigate to Usages from the left navigation menu.
- Review key statistics, including request counts, errors, and average response times.
Use the trend charts to identify peak usage hours and plan scaling or optimizations accordingly.